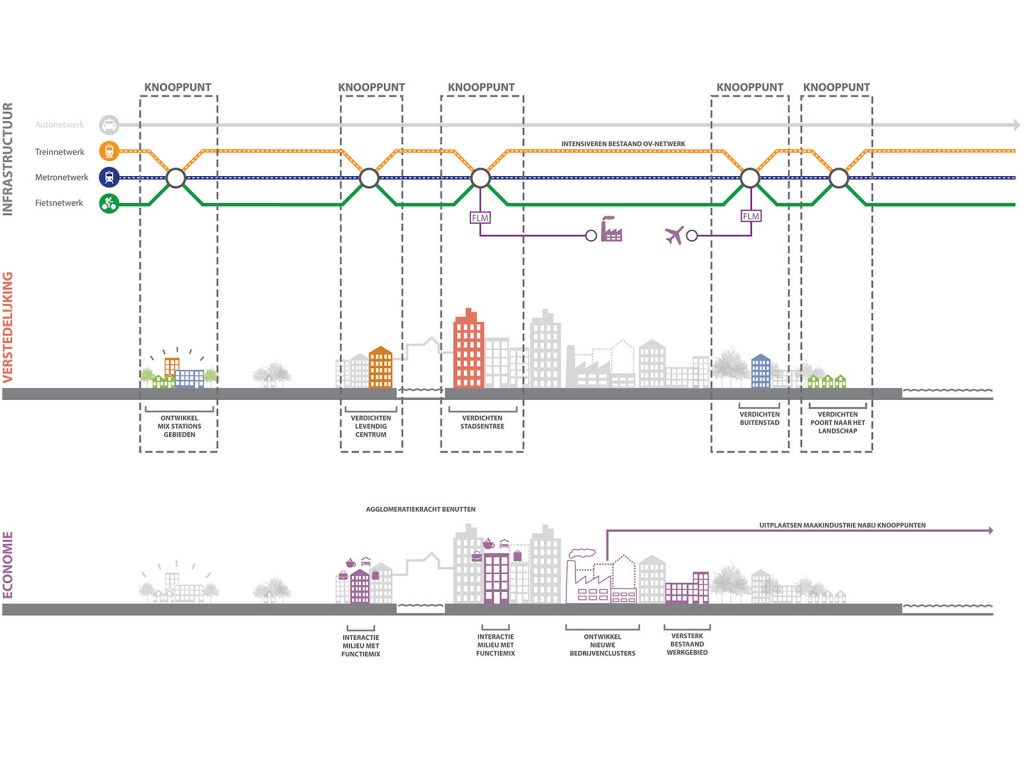
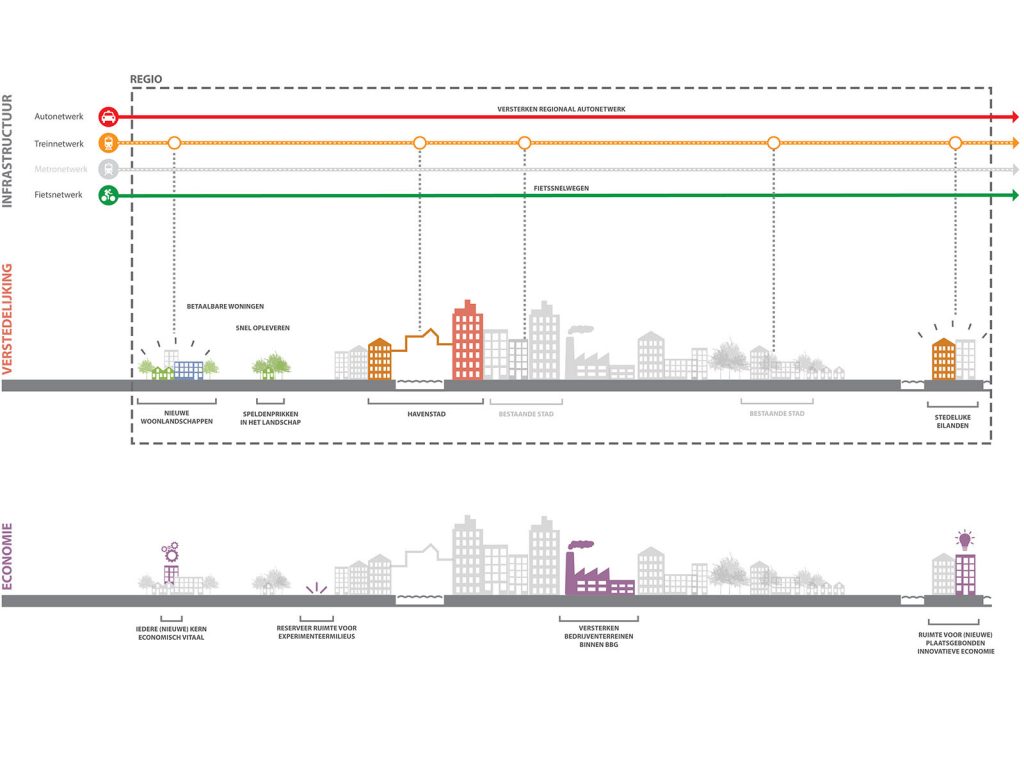
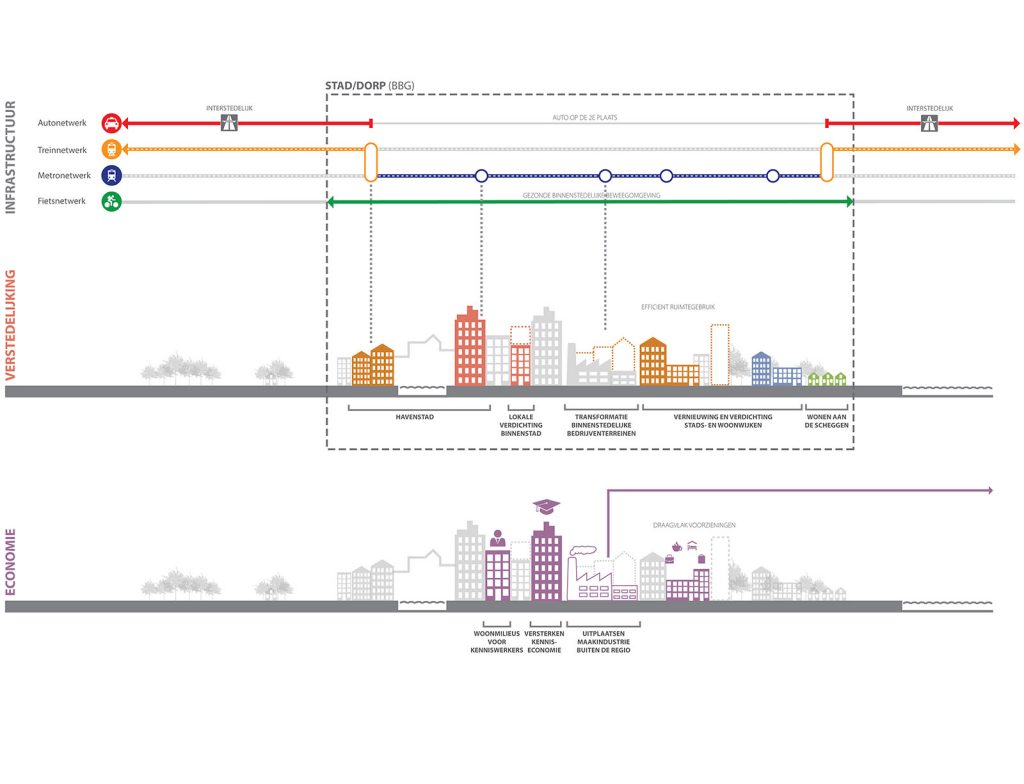
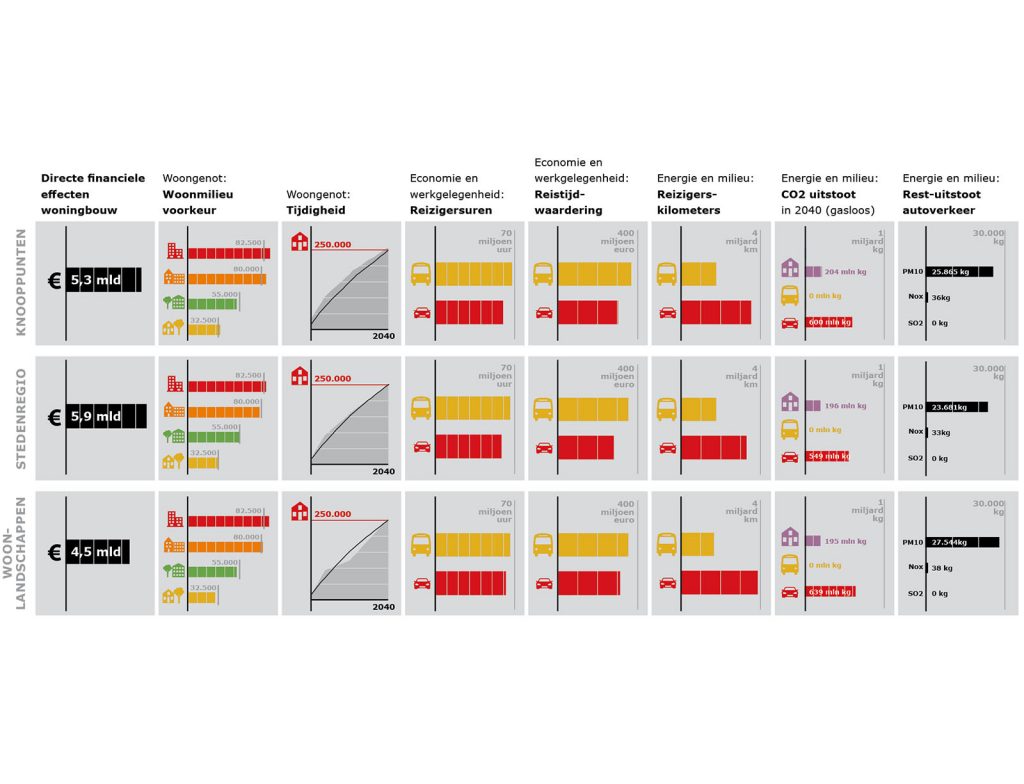
The Board of Government Advisers have asked Urhahn and Rebel to develop a dashboard that provides insight into the social effects of urbanization on a regional scale. The Amsterdam Metropolitan Area has been used as an example. We developed urbanization principles that have been used as input for the dashboard. This is based on a task to add around 230,000 homes to the region. Urhahn developed three development perspectives for this study for the Amsterdam Metropolitan Area. The development perspectives form the input for the dashboard. The dashboard provides insight into the effects of developments near public transport hubs on sustainable mobility, agglomeration power, economic structure reinforcement, sustainability and sustainable energy. The development perspectives are distinguished by urbanization choices (inner-city, hubs, or on the outskirts of the city). Logical infrastructural measures are linked to urbanization choices. Each development scenario thus displays a coherent picture of urbanization and infrastructure choices. This has been worked out in various maps and schemes.
Work
Dashboard for the added value of urbanization
Urhahn has developed a Dashboard for the College van Rijksadviseurs (Board of Government Advisors) in which the social effects of urbanization are visualized.
<
>